A3.1 - A3.6 Graphical Skills
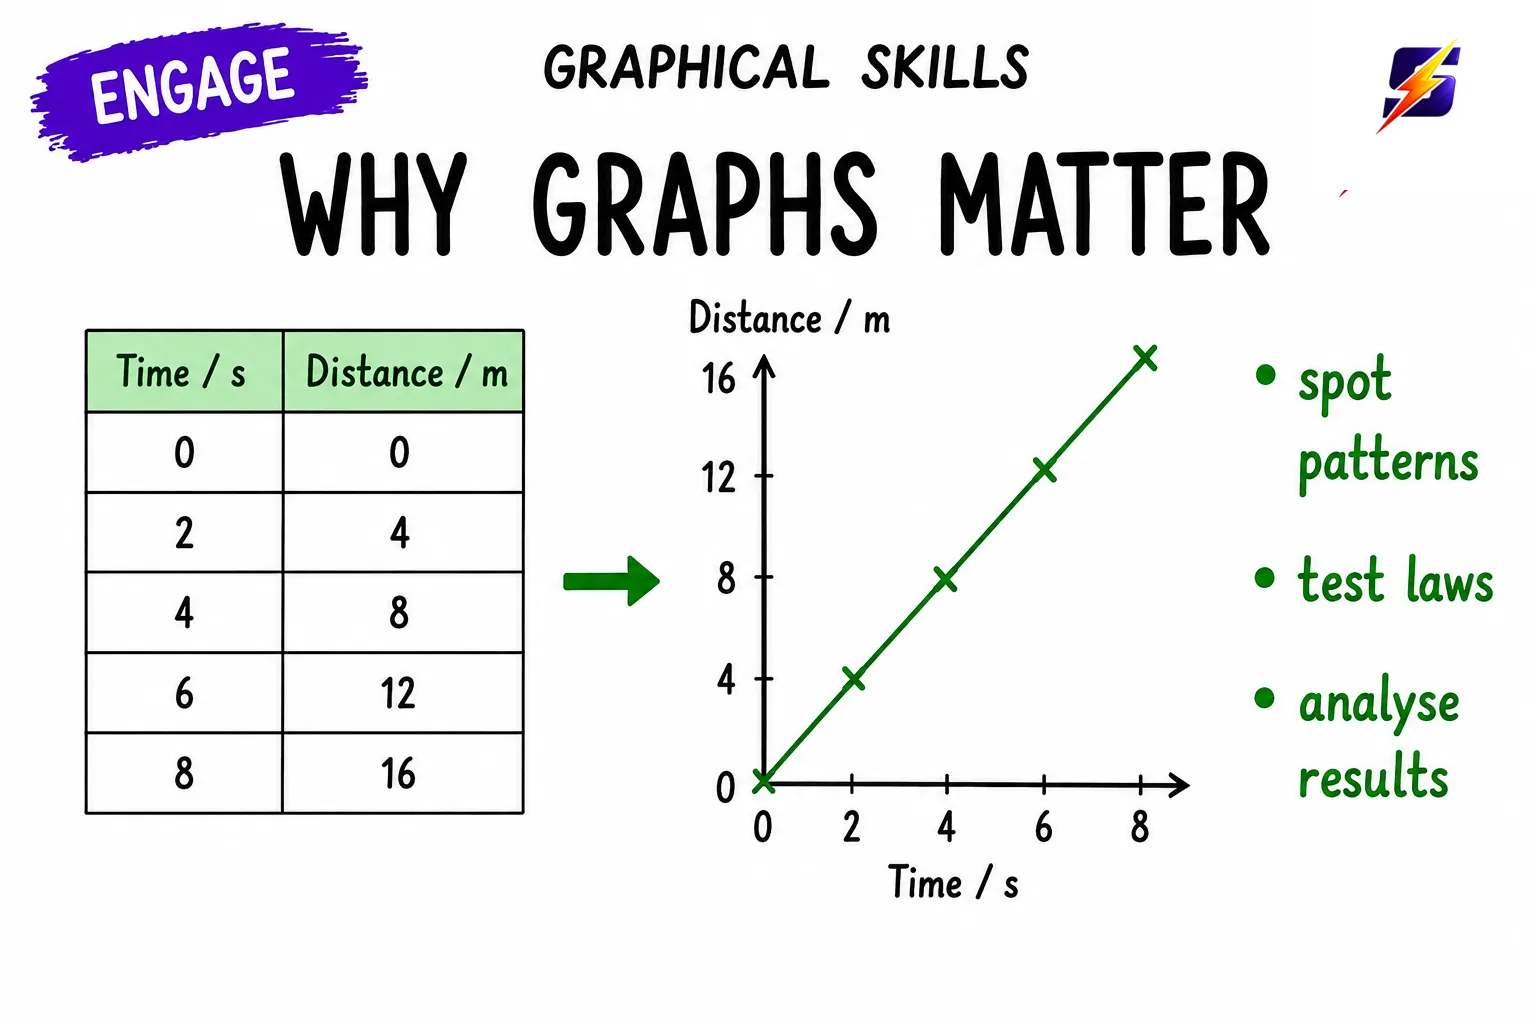
⭐ +165 XP- ✓plot, interpret and use graphs of experimental data
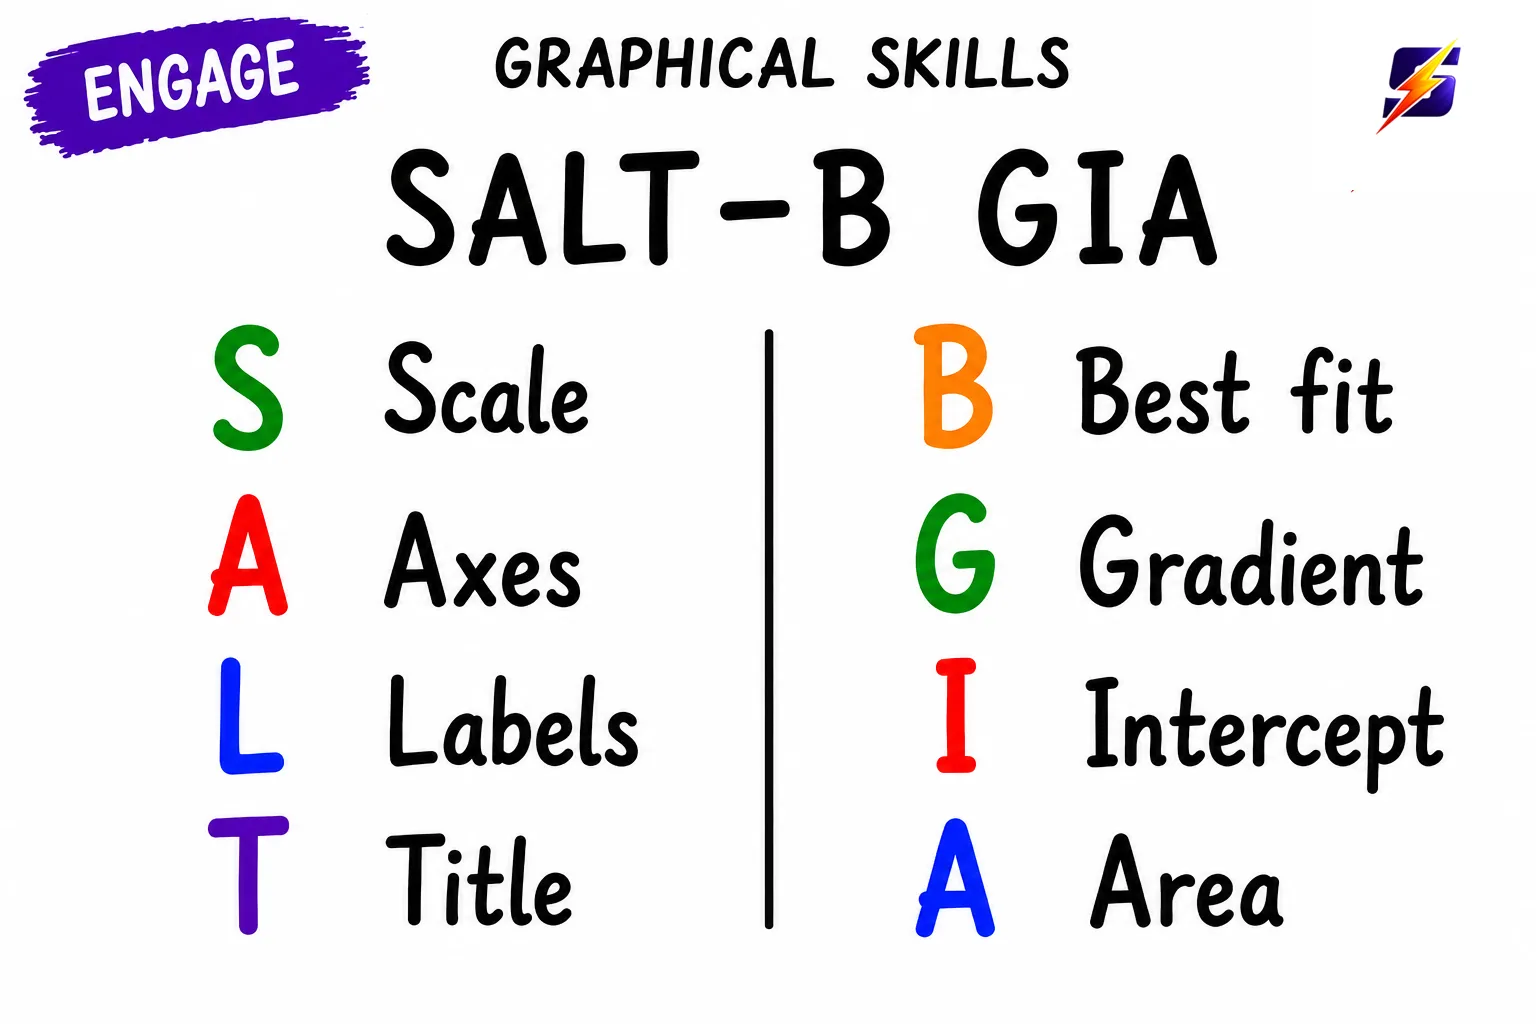
- ✓draw a line of best fit and explain why it gives the best average gradient and intercept
- ✓determine the gradient and intercept of straight-line graphs
- ✓find the area under a graph where appropriate
- ✓draw and interpret curved graphs
⏱ 0 mins🎯 33 marks
Engage
1 / 5
← swipe to move between steps →
0%
Lesson progress0 / 33 marks
✓ 0 correct✕ 0 mistakes0 / 26 answered
Let's get started, you've got this! 💪